Kanban WIP Limits: A Practical Team Guide

Kanban WIP limits are explicit caps on the number of work items allowed in any stage of your board at one time. Start your experiment today: set your “In Progress” column limit to roughly twice the number of people working that stage, then run it for a couple of weeks without changing anything else. Teams that do this consistently see shorter cycle times and far less task-switching within the first sprint.
Here’s what to do right now:
- Count how many items are currently “In Progress” on your board.
- Set a WIP limit at roughly 2 items per person assigned to that column.
- Agree with your team that hitting the limit means finishing before pulling, not ignoring the cap.
- Measure your average cycle time before and after the two-week window.
That single change is enough to surface your first real bottleneck.
Key Takeaways
WIP limits work because they force finishing over starting, and the number you set matters far less than the conversation it triggers when the column is full.
| Point | Details |
|---|---|
| Start with one limit | Set “In Progress” to roughly 2 items per person and run a short experiment before making changes. |
| Measure before and after | Record cycle time and throughput as a baseline; a working limit reduces cycle time without dropping throughput. |
| Treat breaches as signals | When a column hits its cap, swarm, escalate, or reprioritize — never ignore the breach or route around it. |
| Not every column needs a cap | Focus limits on active work stages; backlog and “Done” columns rarely benefit from explicit WIP constraints. |
| Seven supports the experiment | Seven boards offer configurable columns, overdue alerts, and full data export so your WIP data stays yours. |
Table of Contents
- What are Kanban WIP limits and why do they work?
- What benefits do teams actually see from WIP limits?
- How do you set WIP limits step by step?
- Which WIP limit pattern fits your team?
- What metrics tell you whether WIP limits are working?
- How should teams respond when a WIP limit is breached?
- Sample WIP configurations by team size and board layout
- What are the most common WIP limit mistakes?
- How do swimlanes and multi-team boards interact with WIP limits?
- Your 30/60/90-day WIP limit playbook
- Why the “just set a number” advice misses the point
- Seven gives you a board built for this experiment
- Sources
What are Kanban WIP limits and why do they work?
WIP limits are explicit caps placed above board columns that prevent teams from pulling new work until existing items move forward. The logic is grounded in Little’s Law: Cycle Time = WIP / Throughput. Lower your WIP without changing throughput, and cycle time drops proportionally. It’s not a theory; it’s arithmetic.
The four Kanban principles that make limits effective are: visualize all work so nothing is hidden, limit WIP so flow stays predictable, manage flow actively rather than managing people, and make policies explicit so everyone knows the rules. WIP limits are where the second and fourth principles meet. Without an explicit number, “limit WIP” stays a slogan. With one, it becomes a daily decision rule.
Pull-based flow is the mechanism underneath. Instead of pushing work onto whoever is next in line, teams pull only when capacity exists. The WIP limit is what defines “capacity exists.” When a column is full, the signal is clear: help finish something before starting anything new.
What benefits do teams actually see from WIP limits?
The gains are real, but they’re not uniform across every team or workflow.
- Reduced multitasking: When the limit forces a choice between starting and finishing, most people finish. Context-switching drops, and so does the cognitive overhead that comes with it.
- Shorter cycle time: Little’s Law in practice. A team carrying 12 items in progress with a throughput of 3 per week has a 4-week average cycle time. Cut WIP to 6 and the same throughput yields 2 weeks.
- Visible bottlenecks: When one column fills up and stays full, the board tells you where work is stalling. You don’t need a status meeting to find the problem.
- Faster feedback loops: Smaller batches of work reach review and testing sooner, which means defects surface earlier and course corrections cost less.
- Clearer priorities: A full column forces a prioritization conversation. That’s not a side effect; it’s the point.
Software teams tend to see the most dramatic cycle time improvements because their work is relatively uniform in size. Support teams benefit most from the bottleneck visibility. Marketing and content teams often find the biggest win is in priority clarity, since their work tends to be highly variable in scope and urgency.
The before/after picture is worth stating plainly. A team with no limits and 15 items in progress across five people is effectively working on three things each, simultaneously. Set a column limit of 8 for that same team and the board immediately shows which items are stuck, which are moving, and where help is needed.
How do you set WIP limits step by step?
This is a five-step process. Run it as a 30-day experiment, not a permanent policy.
-
Map your workflow and decide column granularity. List every stage work passes through, from backlog to done. Decide whether “In Review” and “In Testing” are separate columns or one. More columns give finer visibility; too many create overhead. For most teams, 4–6 columns is the right range. Note: not every column needs a WIP limit. Backlog columns and “Done” columns rarely benefit from caps. Focus limits on active work stages.
-
Count current actual WIP and measure your baseline. Before setting any limit, record how many items are in each active column right now. Also log your current average cycle time and weekly throughput. Without this baseline, you can’t tell whether the experiment worked.
-
Choose initial limits using a starting formula. A common rule of thumb is 2 items per person for development columns. For a 4-person dev team, a column limit near 8 is common. For review or testing stages with fewer reviewers, scaling down to about 1.5 times the number of people assigned to that stage can be a reasonable starting point. Start with limits slightly below your current averages so the constraint is real but not paralyzing.
-
Enforce limits as conversation triggers, not hard blocks. When a column hits its limit, the team’s response should be a question: “What can we finish right now?” not a software error message. Define your breach response explicitly before you start: swarm on the blocked item, escalate if it’s externally blocked, or reprioritize if something more urgent arrived. Write this policy down and post it on the board.
-
Measure, review, and adjust every two weeks. After each two-week window, compare cycle time and throughput against your baseline. If cycle time dropped and throughput held steady or improved, the limit is working. If the column is almost never full, loosen it. If the team is constantly swarming, tighten it or investigate the upstream cause.
Meeting cadence: A daily flow standup (10 minutes, focused on blocked items and column fullness) catches problems fast. A weekly flow review (30 minutes) looks at the cumulative flow diagram and throughput trend. A biweekly retrospective ties WIP data to team behavior and adjusts limits.
Who owns the experiment? Assign one person, typically a team lead or Kanban coach, to track the metrics and facilitate the reviews. Everyone on the team owns the behavior; one person owns the data.
Pro Tip: For teams with highly variable task sizes, count by story points rather than raw item count. A column limit of 13 points behaves more predictably than a limit of 3 items when one of those items is an epic and two are bug fixes.
Which WIP limit pattern fits your team?
Different teams need different constraint structures. Here’s how the main patterns compare:
| Pattern | How it works | Best for | Watch out for |
|---|---|---|---|
| Per-column | Cap on items in each board column | Single-stream software teams | Doesn’t catch individual overload |
| Per-person | Each person has a personal item limit | Specialist teams, solo contributors | Hard to enforce in shared columns |
| Per-team (CONWIP) | Total WIP across all active columns is capped | Cross-functional, multi-stage flows | Requires strong flow discipline |
| Swimlane caps | WIP limit applied within a specific lane | Support vs. feature split, class-of-service | Adds governance complexity |
Per-column limits are the most common starting point and the easiest to explain. They work well when work flows through a predictable sequence and team members share columns.
Per-person limits make sense when individual multitasking is the core problem and when people work in parallel rather than in sequence. They’re harder to visualize on a shared board but can be tracked with a simple personal WIP rule posted in the team agreement.
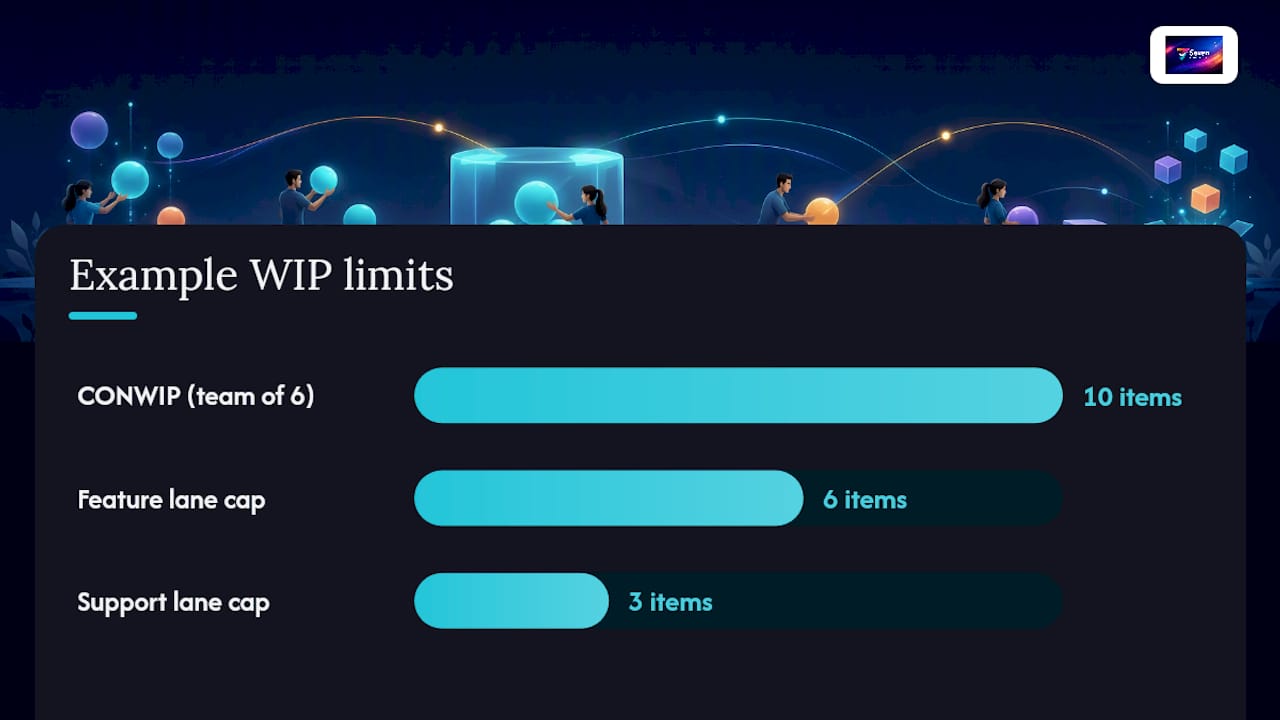
CONWIP (Constant Work in Progress) caps the total number of active items across all stages. A team of 6 might set a total WIP of 10, regardless of where those items sit. This approach suits cross-functional teams where work doesn’t follow a strict left-to-right column sequence. The governance challenge is that it requires the team to self-organize around the total, which demands more maturity.
Swimlane caps combine column limits with lane-level constraints. A support lane might cap at 3 items while a feature lane caps at 6. Pairing swimlanes with WIP limits forces useful prioritization conversations that a single column limit can’t trigger. The trade-off is added complexity in tracking and enforcement.
Combining patterns is legitimate. A team might use per-column limits for their main flow and add a swimlane cap for urgent/expedite items to prevent those from consuming all capacity.
What metrics tell you whether WIP limits are working?
Track these five, in this order of priority:
- WIP per column and per person: The most direct signal. If a column’s WIP is consistently at or above its limit, you have a bottleneck. If it’s consistently below, the limit may be too loose to create useful pressure.
- Cycle time: Average time from “started” to “done” for a work item. This is your primary outcome metric. A downward trend over 4–6 weeks confirms the experiment is working.
- Throughput: Items completed per week. Healthy WIP limits tend to stabilize or increase throughput. A drop in throughput alongside lower WIP usually signals a different problem, often blocked items or unclear priorities.
- Lead time: Time from request to delivery. Longer than cycle time by definition, but useful for customer-facing commitments.
- Work item age: How long each active item has been in its current column. Items aging beyond your target cycle time are candidates for swarming or escalation.
Reading a cumulative flow diagram (CFD) is worth learning. The CFD shows the count of items in each stage over time as stacked bands. Widening bands in a specific stage mean work is accumulating there faster than it’s leaving, which is a bottleneck. Flat lines across the whole board mean throughput has stalled. A healthy CFD shows bands of roughly consistent width moving steadily to the right.
Run each experiment for at least 2–4 weeks before drawing conclusions. Weekly throughput is noisy; you need enough data points to see a trend rather than a fluctuation.
How should teams respond when a WIP limit is breached?
A breach is a signal, not a failure. The right response is a conversation, not a workaround.
Policy template: When column X reaches its limit, the team applies one of three responses within the same day:
- Swarm: Two or more people shift focus to help finish an item in that column before pulling anything new.
- Escalate: If the item is blocked by an external dependency, the team lead contacts the blocker and sets a resolution timebox (typically 24–48 hours).
- Reprioritize: If a genuinely higher-priority item arrived, the team explicitly decides to swap it in and moves the displaced item back, updating the board to reflect the change.
The escalation flow matters. Identify who makes the call (team lead, product owner, or both), what information they need (which item, why it’s blocked, what unblocking requires), and how long they have to respond before the team escalates further.
Azure Boards treats WIP limits as soft constraints that highlight when a column exceeds its cap rather than blocking movement entirely. That’s the right model. Hard blocks that prevent card movement create frustration and workarounds. A visual highlight that triggers a conversation creates learning.
Pro Tip: *Log every breach: date, column, cause (blocked, new priority, misestimate, or team agreement to exceed), and resolution. Review the breach log in your biweekly retrospective. After 4–6 weeks, patterns emerge.
Sample WIP configurations by team size and board layout
Use these as starting points, not permanent settings. Adjust after your first two-week review.
Single-stream dev team (4 people): In Progress = 6, In Review = 3, In Testing = 2. Tighten In Progress to 4 if cycle time stays above two weeks after the first experiment.
Support + feature split (swimlanes, 6 people): Support lane: In Progress = 3, In Review = 2. Feature lane: In Progress = 6, In Review = 3. Total board WIP = 14. This configuration protects planned feature work from being consumed by reactive support volume.
Content/marketing board (4 people): In Progress = 4 (count by piece, not by task), In Review = 2, In Approval = 2. Marketing work tends to have longer review cycles, so the In Review cap is deliberately tight to surface delays early.
The rationale in each case is the same: set the limit low enough that it creates occasional pressure, but not so low that the team is constantly blocked. If the column is never full, the limit isn’t doing anything.
What are the most common WIP limit mistakes?
Most teams hit at least two of these in the first month.
- Setting limits and then ignoring them. A number on the board that nobody enforces is decoration. The limit only works if the team has agreed on a breach response and actually uses it.
- Applying one number to every column. A “Done” column doesn’t need a cap. A backlog column with 200 items doesn’t benefit from a limit of 10. Right-sizing limits depends on the column’s role in the flow.
- Using hard software blocks. Preventing card movement by design turns a flow tool into a rigid process gate. Teams route around it, which destroys the data and the trust.
- Miscounting blocked items. A blocked item sitting in “In Progress” still counts against the WIP limit. If you don’t track blockers separately, your WIP count is misleading and your limits will feel tighter than they are. Track blocked items with a flag or a separate swimlane, but count them.
- Tightening limits too fast. Dropping from 12 to 4 in one step causes pain without giving the team time to adapt. Move in increments of 2 and wait at least two weeks between changes.
- Applying item counts when sizes vary wildly. Three items that are each a week of work are not the same as three bug fixes. For teams with high size variance, story-point-based limits give a more accurate picture of actual load.
When WIP limits won’t fix the problem: if the team is consistently blocked by external dependencies, a resource shortage, or unclear requirements, lowering the WIP limit won’t help. It will just make the blockage more visible, which is useful for diagnosis but not a cure. Address the root cause directly: fix the dependency, hire for the shortage, or improve the definition-of-ready process.
How do swimlanes and multi-team boards interact with WIP limits?
Swimlanes are horizontal rows on a Kanban board that group work by class of service, team, or responsibility. A swimlane diagram groups process steps by actor and makes handoffs visible in a way that column-only boards can’t. When a support team and a feature team share a board, swimlanes let each stream have its own WIP limit without collapsing everything into a single column cap.

Swimlanes visually separate responsibilities and help identify where delays and handoffs occur. Without a WIP limit, a swimlane is just a visual organizer. With one, it becomes a capacity constraint that forces the team to decide what matters most when the lane is full.
For class-of-service lanes such as expedite, standard, fixed-date, or intangible, the expedite lane often carries a very low WIP limit to prevent it from absorbing excessive urgent work. That single constraint prevents the expedite lane from becoming a dumping ground for anything someone calls urgent.
In multi-team contexts, CONWIP often outperforms per-column limits because it accommodates the irregular flow patterns that emerge when work crosses team boundaries. Set a total WIP for the shared board, then let each team self-organize within that constraint. Cross-team replenishment meetings (weekly or biweekly) become the mechanism for deciding what enters the shared pool.
Pro Tip: When modeling a multi-team board with swimlanes, draw the handoff points explicitly. Mark where work moves from one lane or team to another. Those handoff points are where WIP accumulates most. Apply your tightest limits there first.
Your 30/60/90-day WIP limit playbook
This is a disciplined experiment, not a one-time setup.
Days 1–30: Establish the baseline and run the first experiment
- Team lead maps the workflow and agrees on column granularity with the team. (Owner: team lead)
- Everyone counts current WIP per column and records baseline cycle time and throughput. (Owner: team lead + all members)
- Set initial limits using the 2-items-per-person formula. Post the breach policy on the board. (Owner: team lead)
- Run daily flow standups for 10 minutes. Focus on blocked items and column fullness. (Owner: rotating facilitator)
- At day 14, hold a 30-minute flow review. Compare cycle time and throughput to baseline. Adjust limits if needed. (Owner: team lead)
Days 31–60: Refine limits and add metrics
- Add cycle time and throughput tracking to a simple chart (a spreadsheet works fine). (Owner: team lead)
- Introduce the cumulative flow diagram if your board tool supports it. Review it weekly. (Owner: team lead)
- Hold a biweekly retrospective that includes the breach log. Identify the top recurring cause. (Owner: team + facilitator)
- Adjust one limit at a time, in increments of 2, based on data. (Owner: team lead, approved by team)
- Share a one-page summary of results with the product owner or manager. (Owner: team lead)
Days 61–90: Scale or stabilize
- If results are positive, extend the approach to additional columns or swimlanes. (Owner: team lead + product owner)
- If a specific column is consistently the bottleneck, investigate root cause and address it directly. (Owner: team lead + relevant stakeholders)
- Decide whether to formalize the limits as standing policy or continue experimenting. (Owner: team + product owner)
- Document the final configuration and rationale for onboarding future team members. (Owner: team lead)
Hand off progress to product owners at day 30 and day 60 with a brief written summary: current limits, key metric changes, and the next planned adjustment. This keeps leadership informed without requiring them to attend every flow review.
Why the “just set a number” advice misses the point
Most articles on WIP limits treat the number as the answer. Pick 2 per person, set it, done. That framing is why so many teams set limits and then quietly stop enforcing them three weeks later.
The number is not the point. The conversation the number forces is the point. When a column hits its limit and the team has to decide whether to swarm, escalate, or reprioritize, that decision reveals something real about how work actually flows, where the real bottlenecks are, and whether the team’s stated priorities match their actual behavior.
Teams that treat WIP limits as a policy to comply with get marginal results. Teams that treat them as a diagnostic instrument get genuinely useful data. The difference is whether the breach triggers a conversation or a workaround.
Start smaller than you think you need to. One column, one limit, two weeks. The experiment will tell you more than any formula.
Seven gives you a board built for this experiment
Seven gives teams flexible Kanban boards with configurable columns, task and subtask management, due date tracking, and overdue alerts, all without locking your data into a proprietary format. You can import your existing tasks from a spreadsheet in minutes, set up your columns, and start your WIP limit experiment the same day.
The platform is built by an independent team with no data mining and no analytics sold to third parties. Your board data stays yours. For teams that care about data privacy alongside workflow discipline, that’s a meaningful distinction.
Pricing starts at $5 per month for individuals and $9 per user per month for teams, with a 7-day free trial and no hidden costs. Check the pricing and trial details to see what fits your team size. Import your board, apply a starter WIP configuration from the sample table above, and run your first two-week experiment without any setup overhead.
Sources
The sources below back the claims and frameworks in this article and are worth reading directly for deeper context.
- Set Work in Progress limits in Azure Boards - Microsoft Learn
- Does Every Column on the Board Need a WIP Limit?
- Swimlane tutorial — Lucid